
Disclaimer: The information posted in this blog and on this website are not necessarily reflective of the views or recommendations of Microsoft. Though I am an employee of Microsoft, this is considered a personal project of mine that is not intended to be a recommendation or guide from Microsoft the company.
In this blog, I will detail how you can create scheduled, customized email reports about MDE alerts using Power Automate. These reports will provide details about alerts for specific device groups. As an example, using these steps, you can create a report to be sent daily, weekly, or monthly that might look something like this:
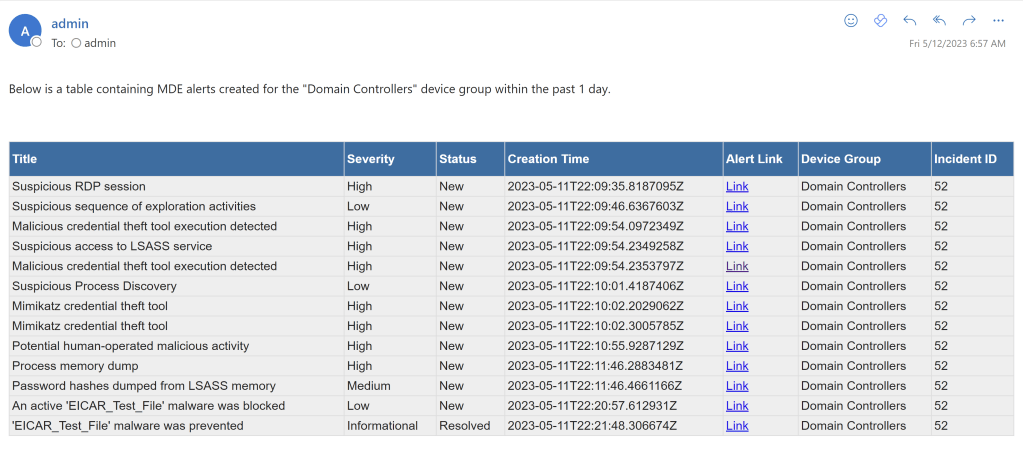
In this example, I’ve chosen the above columns, however you will be able to craft your own HTML table using columns such as detection source, category, machine ID, machine name, threat name, alert description, and more.
Getting Started
You will need a Power Automate Premium license to be able to access the Microsoft Defender ATP connector in Power Automate. More information about Power Automate Premium licenses found here: Types of Power Automate licenses
To begin, head over to https://powerautomate.com and click Create.
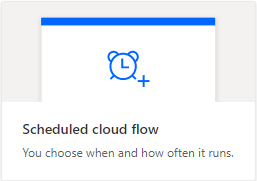
I will be scheduling this flow to happen every day, so I will choose “Scheduled cloud flow”.
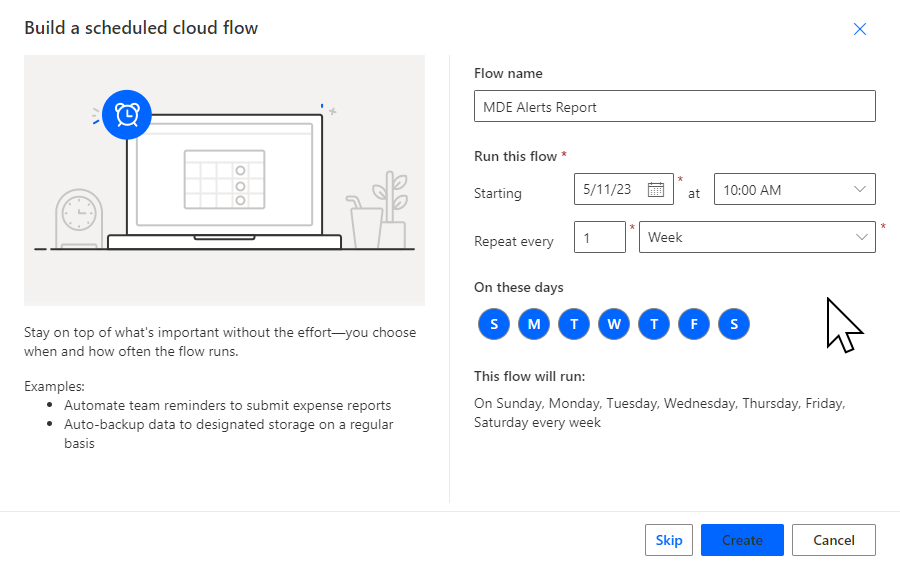
Give your flow a name then change it to repeat every week and click Create.
Next we will add a new step named “Alerts – Get list of alerts” from the Microsoft Defender ATP connector. To get alerts created within the past 1 day, add the following line to the “Filters results” field:
alertCreationTime ge @{getPastTime(1, ‘Day’)}
To sort the results by creation time, add the following line to the “Sorts results” field:
alertCreationTime asc

I want to filter this report to only show alerts for a specific device group. You might expect that we can use the “Filter results” field like we do with the alert creation time above, however this option is not supported for device groups, even though this data is exposed to the connector. Below is the error you would receive, but we will work around this later on.

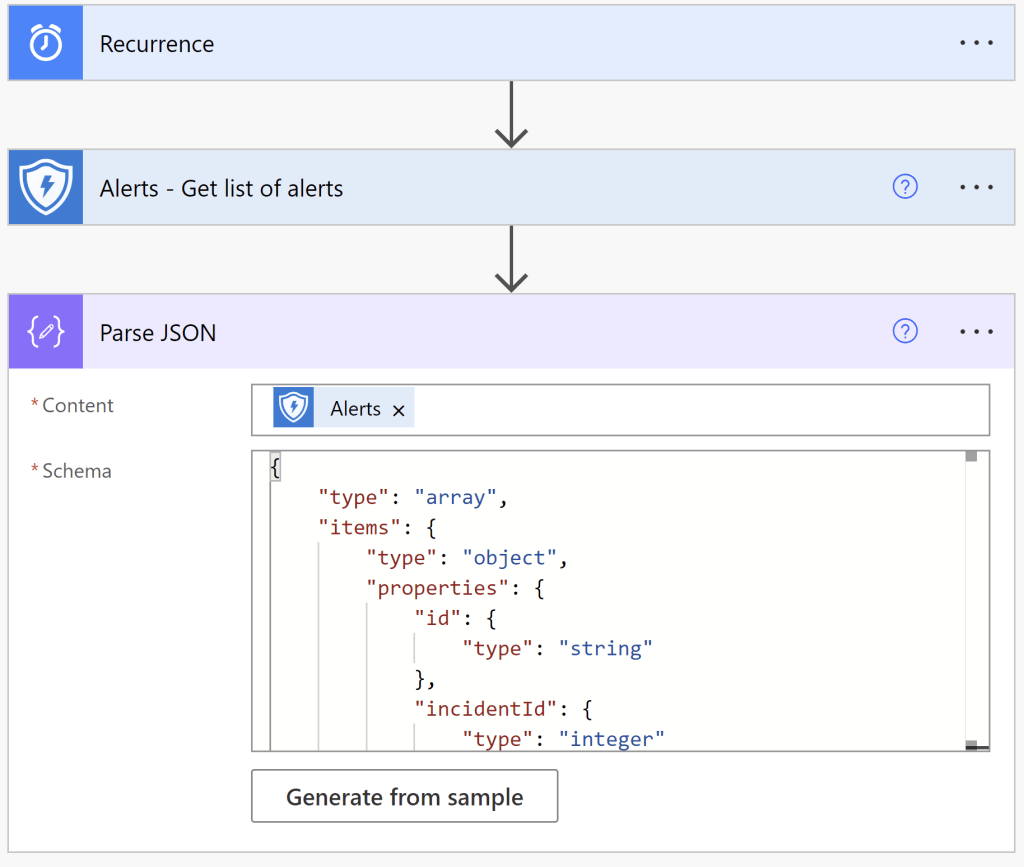
The filter query option only supports very limited options for filtering so, instead we will use the Parse JSON action to allow us to filter on any of the exposed data that we wish.
Add the Parse JSON action next, and set the content to Alerts. For the schema, paste the below:
{
    "type": "array",
    "items": {
        "type": "object",
        "properties": {
            "id": {
                "type": "string"
            },
            "incidentId": {
                "type": "integer"
            },
            "severity": {
                "type": "string"
            },
            "status": {
                "type": "string"
            },
            "investigationState": {
                "type": "string"
            },
            "detectionSource": {
                "type": "string"
            },
            "detectorId": {
                "type": "string"
            },
            "category": {
                "type": "string"
            },
            "threatFamilyName": {
                "type": "string"
            },
            "title": {
                "type": "string"
            },
            "description": {
                "type": "string"
            },
            "alertCreationTime": {
                "type": "string"
            },
            "firstEventTime": {
                "type": "string"
            },
            "lastEventTime": {
                "type": "string"
            },
            "lastUpdateTime": {
                "type": "string"
            },
            "resolvedTime": {
                "type": "string"
            },
            "machineId": {
                "type": "string"
            },
            "computerDnsName": {
                "type": "string"
            },
            "rbacGroupName": {
                "type": "string"
            },
            "aadTenantId": {
                "type": "string"
            },
            "threatName": {
                "type": "string"
            },
            "mitreTechniques": {
                "type": "array"
            },
            "loggedOnUsers": {
                "type": "array"
            },
            "comments": {
                "type": "array"
            },
            "evidence": {
                "type": "array"
            },
            "domains": {
                "type": "array"
            },
            "investigationId": {
                "type": "integer"
            }
        },
        "required": [
            "id",
            "incidentId",
            "severity",
            "status",
            "investigationState",
            "detectionSource",
            "detectorId",
            "category",
            "title",
            "description",
            "alertCreationTime",
            "firstEventTime",
            "lastEventTime",
            "lastUpdateTime",
            "machineId",
            "computerDnsName",
            "rbacGroupName",
            "aadTenantId",
            "mitreTechniques",
            "loggedOnUsers",
            "comments",
            "evidence",
            "domains"
        ]
    }
}
Your flow should look like this now:
Next, add a Filter array action with the body of the Parse JSON in the “From” field. We’re going to filter on the device group named “Domain Controllers”.

Now that we have our filter set, we can begin forming our HTML table. To do this, we will use the Select action from the body of our filter array and map out the columns we wish to use.
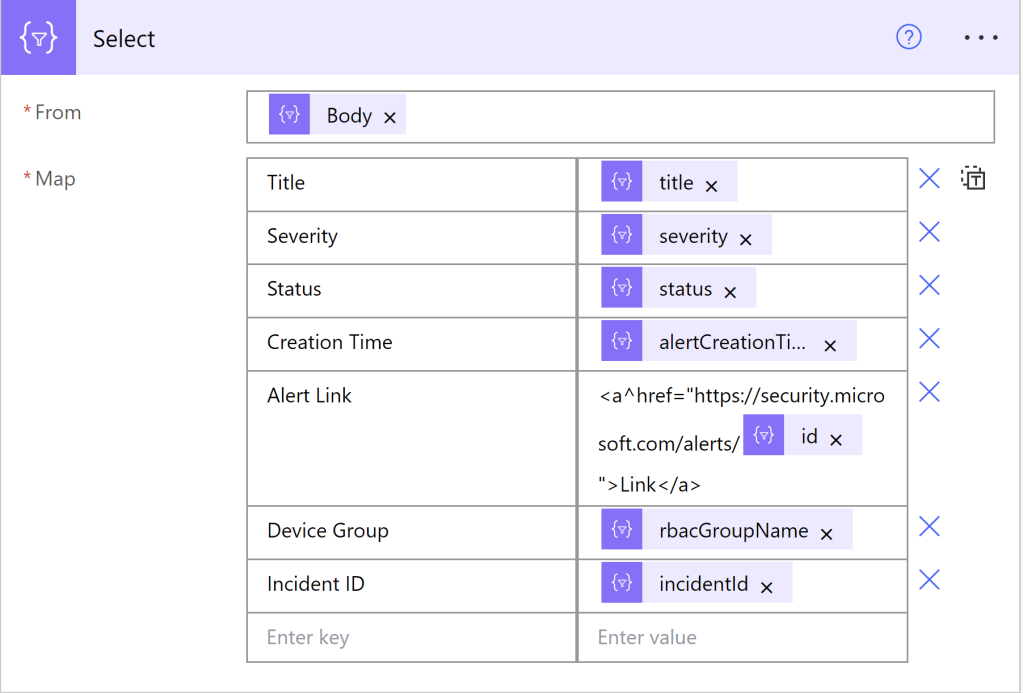
I’ll be using the columns seen above, but please look through the dynamic content available to see which other columns you might like to add.
For the alert link to format properly and be available as a hyperlink in the email, take the “id” dynamic content from the filter array and paste it between these two strings:
<a^href=”https://security.microsoft.com/alerts/
and
“>Link</a>
as pictured above.
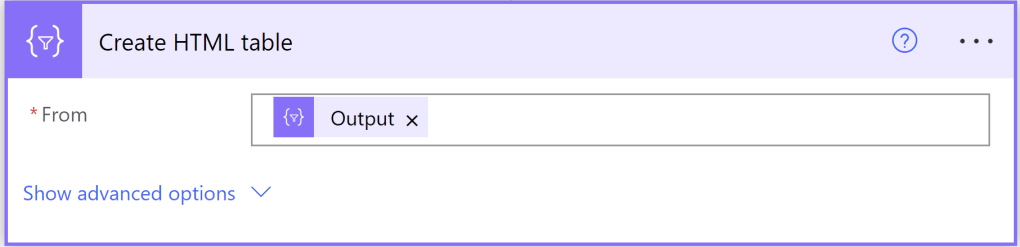
Next, add a Create HTML Table action from the output of the Select action.
Then add a Compose action with the following input:
@{replace(body(‘Create_HTML_table’),’^’,’ ‘)}

Now we’ll do one last step before forming the email. In order to make our HTML report look a little bit nicer, we’ll add another Compose action and paste the below CSS code.
<style>
Table {
  font-family: Arial, Helvetica, sans-serif;
  background-color: #EEEEEE;
  border-collapse: collapse;
  width: 100%;
}
Table td, Table th {
  border: 1px solid #ddd;
  padding: 3px 3px;
}
Table th {
  font-size: 15px;
  font-weight: bold;
  padding-top: 12px;
  padding-bottom: 12px;
  text-align: left;
  background-color: #1C6EA4;
  color: white;
}
</style>
Lastly we can form our email, so add one more new step and choose the “Send an Email V2” action.
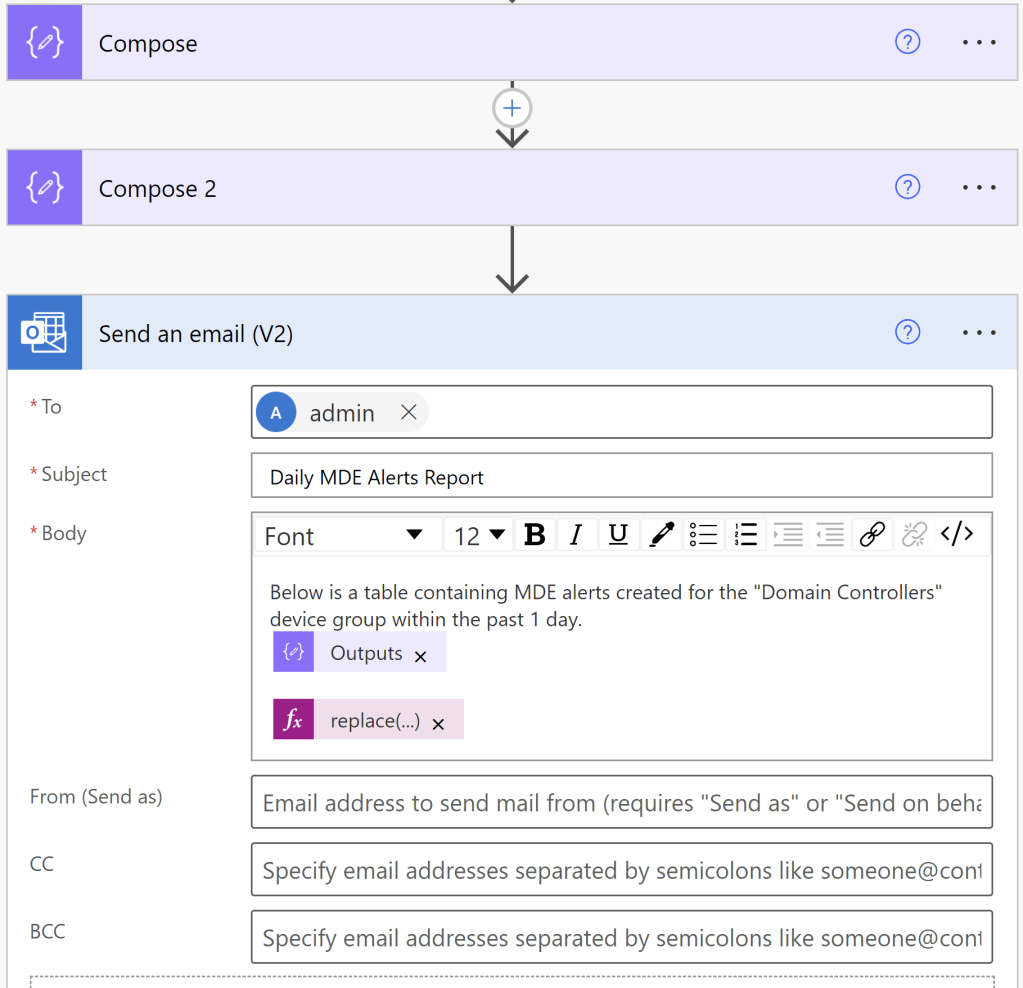
Anywhere in the email body, we will need to put the Outputs from the Compose 2 action where we added the CSS code. And we will add the formatted content of our HTML table by pasting the following expression:
replace(replace(replace(outputs(‘Compose’),’<’,'<‘),’>’,’>’),’"’,'”‘)
Now we can save and test out our flow! Here’s what our email looks like:

Thanks for reading, I hope this was helpful!

One thought on “Creating Custom MDE Alert Email Reports with Power Automate”