
Disclaimer: The information posted in this blog and on this website are not necessarily reflective of the views or recommendations of Microsoft. Though I am an employee of Microsoft at the time of writing, this is considered a personal project of mine that is not intended to be a recommendation or guide from Microsoft the company.
Introduction
Using Microsoft Defender for Endpoint (MDE), you can create indicators of compromise (IoCs) based on artifacts such as file hashes, IP addresses, URLs or domains, and certificates. These indicators help defenders detect these artifacts which may indicate potentially malicious behavior in their environments.
However, defenders should ask themselves:
“Does an indicator of compromise lose its value over time?”
Is that IP address we blocked four years ago still being used to host malware? Is our indicator redundant? Perhaps our antivirus solution has detections for it already and our EDR will alert on it even without our indicator.
Microsoft has published a tech community post on this exact topic which recommends setting expiration dates on custom indicators and also recommends periodic review and clean up.
In this blog post, I will be using Power Automate to automatically build reports containing MDE custom indicators which expire within 30 days. This report can notify security personnel of indicators that have upcoming expiration dates so that they can be reviewed before determining whether to renew the expiration date or to just let it go.
Getting Started
You will need a Power Automate Premium license to be able to access the Microsoft Graph Security connector in Power Automate. More information about Power Automate Premium licenses found here: Types of Power Automate licenses
To begin, head over to https://powerautomate.com and click Create.
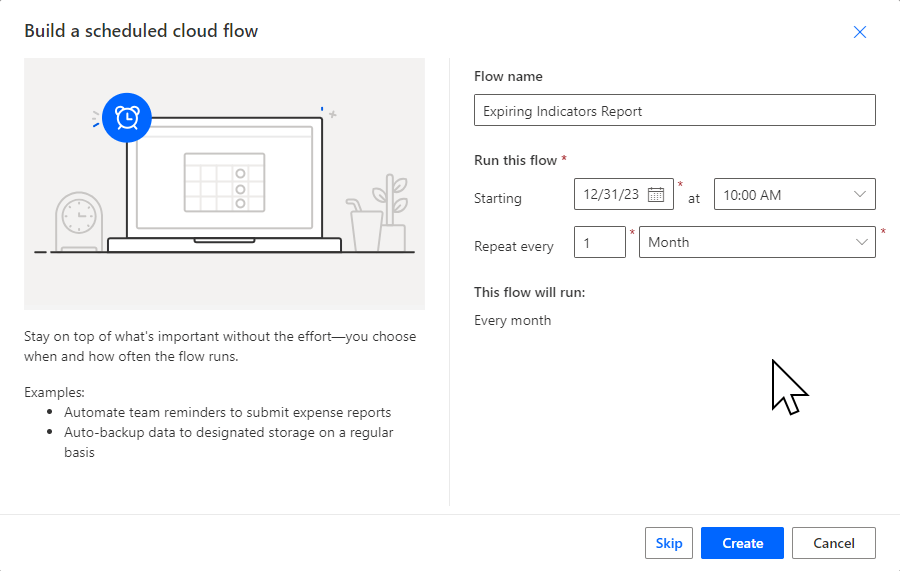
I will be scheduling this flow to happen once a month so I will choose “Scheduled cloud flow”.
Give your flow a name, choose the repeating cadence and click Create.
Getting the Indicators
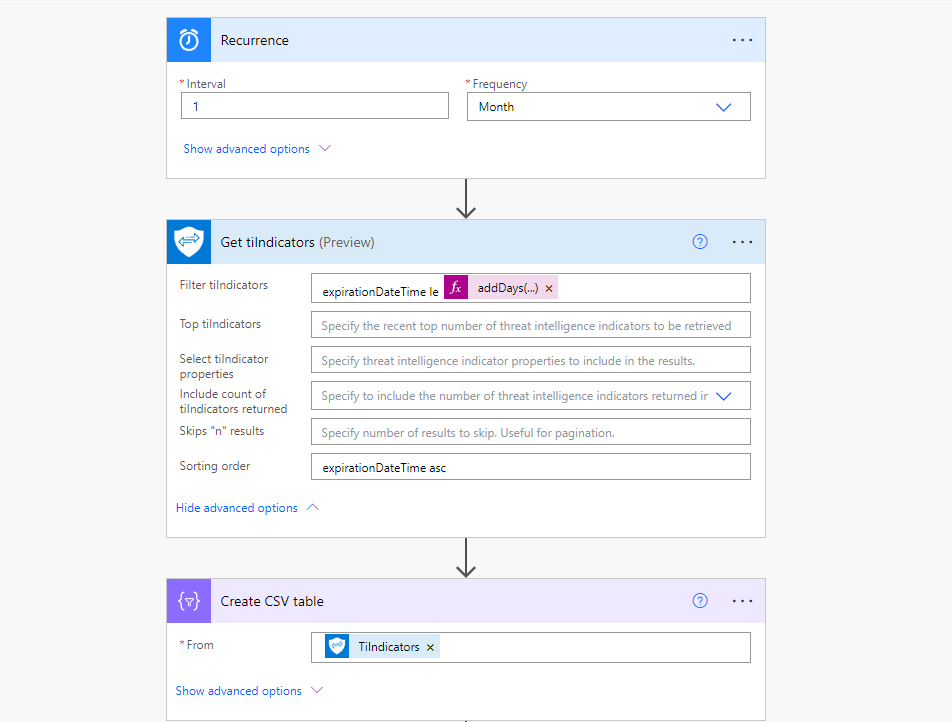
Add a step to your new automation flow and search for “Microsoft Graph Security” then choose the “Get tiIndicators” step. This step allows us to specify which indicators we want to get.
In this example, I am only interested in indicators which have an expiration date that is within the next 30 days, but you can modify this however you please. In order to accomplish this, In the ‘Filter tiIndicators’ field I will add the below line:
expirationDateTime le @{addDays(utcNow(), 30)}This is essentially checking the ‘expirationDateTime’ property of each indicator and only including those where it is less than or equal to 30 days from right now (the time of the flow running). Please note that indicators that have been set to never expire do not have this property. If you have many indicators which have been set to never expire, yet you wish to review them and include them in this report, then you should consider replacing the ‘expirationDateTime’ property with the ‘ingestedDateTime’ which is the date in which the indicator was created. Upon reviewing those indicators, you can choose to update them with an expiration date.
In this step, you can manipulate this data in other ways such as sorting by certain criteria, selecting only a top number, only selecting certain properties of the indicators to return, and more. In this example, I will just sort by the expiration date so I will add the following to the ‘Sorting order’ field:
expirationDateTime ascBuilding the Report
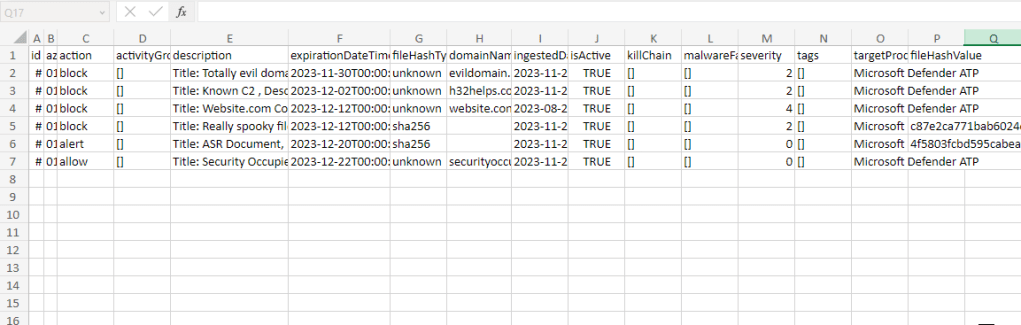
Who doesn’t love a good spreadsheet, right? In this example, I will just be creating a CSV table with the indicator data because it is extremely simple and gets the job done. Perhaps you have greater ambitions to build this data into some slick dashboard?
Going the CSV route, just add another step to the automation flow and choose ‘Create CSV table’. In the ‘From’ field, select the ‘TiIndicators’ dynamic content.
Checkpoint
Your flow should probably look something like this if you have been following along:
Now it is time to think about how to deliver this report. In its current state, this flow will run every month and this data will be available in the flow run history. But then we would need to check the flow history every month which defeats the whole purpose.
We could always send the report in an email to the security person(s) who will be reviewing it, but you may have some concerns about sending this data in an email. We could upload it to a secured file share or OneDrive/SharePoint location. We could even encrypt it and send an email to the security person(s) notifying them that the new report is available in the secure location. My point here is that there are many connectors in Power Automate that can do these various things and you may have your own ideas of how you’d like to handle these reports.
Delivering the Report
In this example, I will simply be sending an email to the security person(s) with the report as an attachment. To do this, simply add a new step and choose “Send an email (V2)”. Choose your recipients and add your subject and body. Note that you can include hyperlinks so if you chose to upload the file to a secure location first, perhaps you may want to send a link to the secure location here so the recipient can authenticate and access the file that way.

To add the file directly to the email as an attachment, click the “Show advanced options” button. Provide an attachment name and ensure it has a file extension of .csv. For the content, choose the Output of the Create CSV table step.
Test out your flow and enjoy!
Thanks For Reading!
Thanks for giving this a read and please check out some of my other blog posts. If you were interested by this one, you will definitely enjoy some of these:
